Two Skills Every Indian Trader and Investor Must Know
Every week at Sharelesh, new students arrive with the same confidence. They know what a stop loss is. They have heard of support and resistance. They have placed a few options trades. And they genuinely believe that this knowledge is enough to trade the stock market profitably.
Within their first session, they discover something uncomfortable – their basics are not clear. They know the terms but not the concepts behind them. They know the tools but not how to use them. They know what to do on a good day but have no framework for understanding why the market is doing what it is doing.
This gap – between surface knowledge and genuine understanding is where most Indian traders lose their money. And at the foundation of that gap is a lack of clarity about two fundamental skills: fundamental analysis and technical analysis.
These two analyses are not just stock market jargon. They are the two lenses through which every serious trader and investor views the market. Without them, you are making decisions in the dark based on tips, signals, and gut feeling. With them, you make decisions based on evidence, logic, and a structured framework.
In my 17+ years at Sharelesh, every student who has become consistently profitable has mastered both in the right sequence, at the right depth, with the right tools. This blog explains exactly what they are, how they work together, and what to learn first.
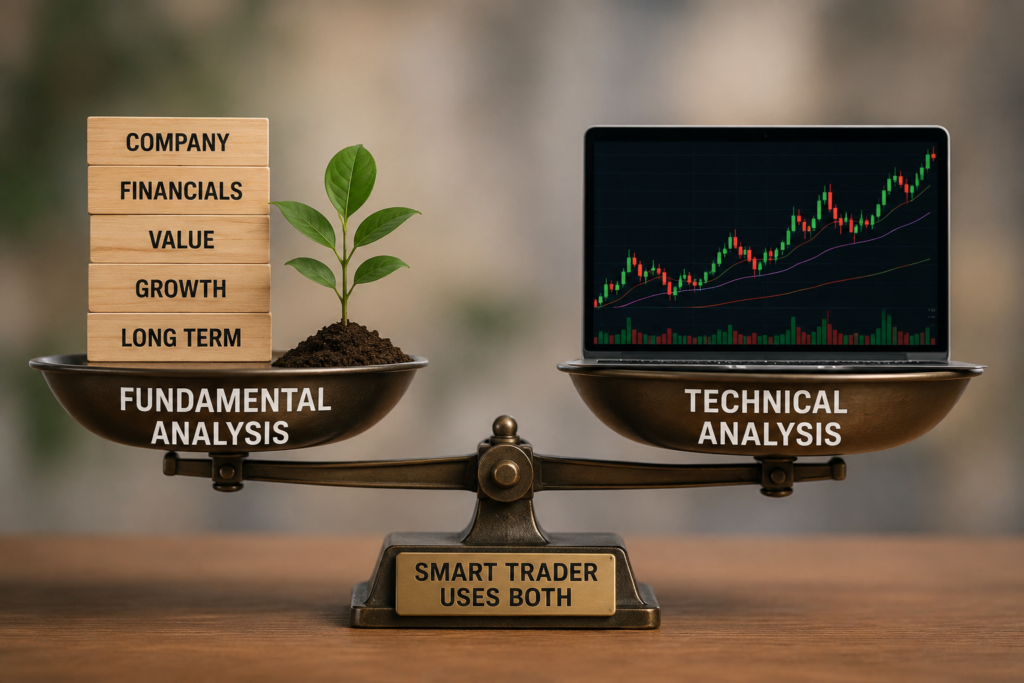
What is Fundamental Analysis? Simple Definition with Example
Fundamental analysis is the method of evaluating a company’s true value by studying its financial health, business model, management quality, and overall economic environment.
In simple words – fundamental analysis answers the question: Is this company worth investing in?
It does not care about what the stock price did yesterday. It does not look at charts. Instead, it digs into the business behind the stock. How much revenue does this company generate? Is it profitable? Does it carry too much debt? Is the management trustworthy? Is the industry it operates in growing or shrinking?
Simple Indian Example:
Imagine you want to buy a shop in your city. Before paying the price, what do you check?
You check how much monthly income the shop generates. You check whether the shop has any outstanding loans. You check whether the location is good and whether customers visit regularly. You check the reputation of the owner who is selling it to you. And you check whether similar shops in the area are selling for more or less.
All of these checks – before you decide whether the shop is worth buying at the asking price is exactly what fundamental analysis does for a stock. Instead of a shop, you are evaluating a company. Instead of monthly income, you study quarterly revenue and profit. Instead of loans, you study the debt on the balance sheet.
At Sharelesh, we teach students this first: before you put money into any company’s stock, understand the business behind it. Know how it earns money. Know whether it earns more than it spends. Know whether the people running it are trustworthy. Without this understanding, you are not investing — you are guessing.
What is Technical Analysis? Simple Definition with Indian Example
Technical analysis is the method of predicting future price movements by studying historical price charts, trading volume, and market patterns.
In simple words – technical analysis answers the question: When is the right time to buy or sell?
It does not care about the company’s balance sheet. It does not study profits or revenue. Instead, it studies price how it has moved in the past, what patterns it has formed, where buyers and sellers have historically shown strong interest, and what the current momentum of price movement suggests about the near future.
Simple Indian Example:
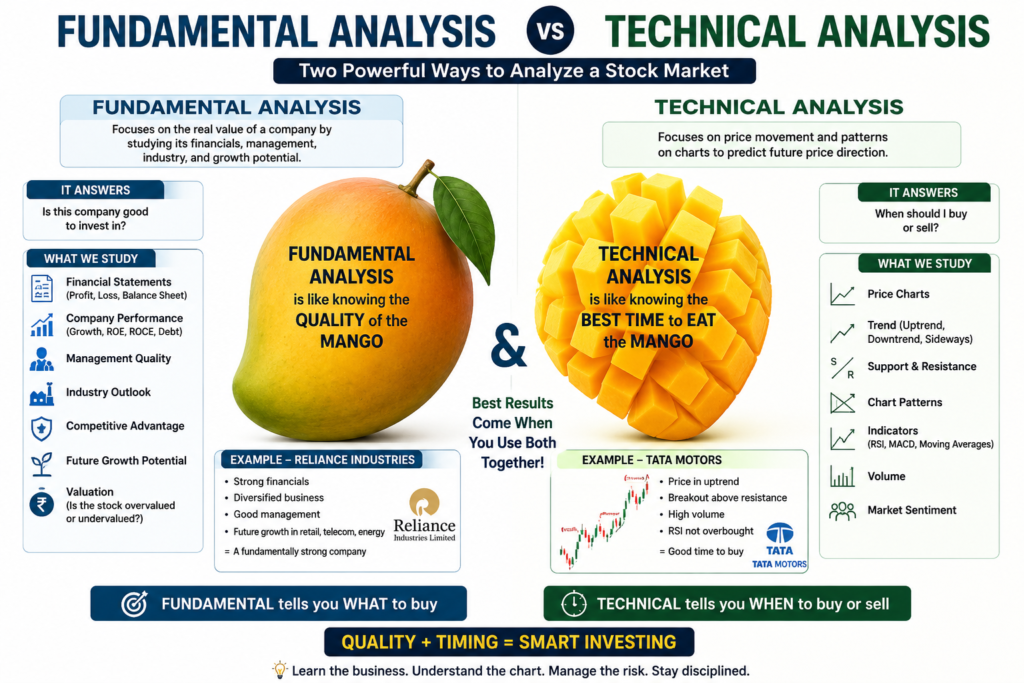
Imagine you want to buy mangoes. You already know the mango farm is excellent — the quality is good, the reputation is strong, and the business is healthy. But mangoes are expensive in March and cheap in June. Technical analysis is what tells you — based on how mango prices have behaved in past years, when to buy at the best price.
You are not questioning whether to buy mangoes. That decision is already made. You are only deciding when to enter the market to get the best price.
This is exactly what technical analysis does for stocks. You use charts, candlestick patterns, support and resistance levels, and momentum indicators to identify the best timing for your entry and exit, once you have already decided, through fundamental analysis, that the company is worth investing in.
The Mango Market Analogy - Understanding Both Analyses in One Story
At Sharelesh, here is the single analogy that makes both analyses permanently clear for every student:
You visit a mango market. You want to buy mangoes to resell at a profit.
Step 1 — Fundamental Analysis: You inspect every mango stall. You taste the mangoes, check their freshness, ask about the farm they came from, and compare the quality across different vendors. After careful evaluation, you identify one stall whose mangoes are clearly superior — best quality, best farm, best reputation. You decide — this is the stall I want to buy from.
Step 2 — Technical Analysis: Now you watch the market. The stall owner’s price fluctuates throughout the day. In the morning, prices are high because demand is strong. By afternoon, prices drop as the crowd thins. You notice that every day around 3 PM, prices hit their lowest point before rising again toward evening.
So you wait. At 3 PM, you buy at the day’s lowest price. You sell in the evening at the peak.
In this story:
- Choosing the RIGHT stall = Fundamental Analysis (finding what is worth buying)
- Choosing the RIGHT TIME to buy = Technical Analysis (finding when to buy it)
Fundamental analysis finds the right company. Technical analysis finds the right entry point.
Both together — used in the correct sequence — produce the most confident, complete trading and investing decisions. This is exactly what Sharelesh teaches every student who wants to move beyond surface-level market knowledge.
Fundamental vs Technical Analysis - Complete Comparison Table
|
Parameter
|
Fundamental Analysis
|
Technical Analysis
|
|---|---|---|
|
Main Question
|
Is this company worth buying?
|
When is the right time to buy or sell?
|
|
What it Studies
|
Financial statements, business model, management
|
Price charts, volume, patterns, indicators
|
|
Time Horizon
|
Long term — months to years
|
Short term — minutes to weeks
|
|
Best For
|
Long term investors, multibagger hunters
|
Traders, intraday, swing traders
|
|
Key Tools
|
PE ratio, ROE, balance sheet, annual report
|
Candlesticks, support/resistance, RSI, MACD
|
|
Data Source
|
Company filings, quarterly results, annual reports
|
Price and volume data on charts
|
|
Decision Output
|
Buy or avoid this company
|
Buy now, wait, or exit
|
|
Ignores
|
Short term price fluctuations
|
Company financials and business quality
|
|
Weakness
|
Cannot tell you when to enter
|
Cannot tell you if the company is fundamentally strong
|
|
Sharelesh Recommendation
|
Learn for investors + multibagger research
|
Learn first for traders
|
Key Tools of Both Analyses - Practical Guide for Indian Beginners
Fundamental Analysis Tools
PE Ratio (Price to Earnings) The PE ratio tells you how much the market is paying for every rs1 of company earnings. A PE of 20 means the market pays rs20 for every rs1 of annual profit. Comparing a company’s PE to its sector average tells you whether it is overvalued or undervalued. However — and this is what most beginners miss — a low PE does not automatically mean a good buy. Understanding the business behind the PE is essential.
ROE (Return on Equity) ROE measures how efficiently a company generates profit from shareholders’ money. A consistently high ROE — above 20% — over multiple years is one of the strongest signals of a quality business. At Sharelesh, ROE consistency is one of the first things we check in any multibagger candidate.
Debt to Equity Ratio This ratio tells you how much debt the company carries relative to its equity. A ratio below 0.5 is generally safe for non-financial companies. High debt means the company pays large interest costs — which eat into profits and create risk during economic downturns.
Annual Report The annual report is the most underused research tool among Indian retail investors. It contains the complete financial picture of a company — revenue, profit, debt, management discussion, future plans, and risk factors. At Sharelesh, reading annual reports before investing in any company is non-negotiable. It is the primary source of ground truth about any business.
Screener.in For Indian stocks, Screener.in is one of the best free fundamental research platforms available. It aggregates all financial data for NSE and BSE listed companies — PE, ROE, revenue growth, profit margins, debt levels — in one clean interface. Every Sharelesh student who learns fundamental analysis uses Screener.in as their primary research tool.
Technical Analysis Tools
Candlestick Patterns Candlesticks are the language of price action. Each candle shows four pieces of information — open, high, low, and close — for a specific time period. Patterns formed by candlesticks — Doji, Hammer, Engulfing, Morning Star — give traders signals about potential price direction changes. At Sharelesh, candlestick pattern recognition is the first technical skill every student learns.
Support and Resistance Support is a price level where buying interest has historically been strong enough to stop a price from falling further. Resistance is a level where selling pressure has historically stopped prices from rising further. These levels are the foundation of all technical analysis — and the most consistently useful tool across all markets and timeframes.
RSI (Relative Strength Index) RSI is a momentum indicator that measures whether a stock is overbought or oversold. An RSI above 70 suggests the stock may be overbought — potentially due for a pullback. Below 30 suggests it may be oversold — potentially due for a bounce. RSI is most useful when confirmed by price action and candlestick patterns.
TradingView For technical chart analysis of Indian stocks, TradingView is the most comprehensive and beginner-friendly platform available. It provides real-time Nifty, Bank Nifty, and individual stock charts with all technical indicators built in. At Sharelesh, TradingView is the primary technical analysis platform we teach on.
Real Indian Stock Example — Same Stock Through Both Lenses
Let us take a hypothetical Indian company — a strong mid-cap manufacturing business — and look at it through both fundamental and technical lenses simultaneously. This is exactly how Sharelesh teaches students to research stocks.
Fundamental Analysis View:
- Revenue growing 20%+ for past 3 consecutive years
- ROE consistently above 22%
- Debt to equity ratio of 0.3 — very low
- Promoter holding stable at 58%
- Operating in a sector with strong government tailwind
- PE ratio at 18 — below sector average of 24
Fundamental conclusion: This is a fundamentally strong company trading below its sector valuation. It qualifies as a potential buy — but timing the entry is the next question.
Technical Analysis View:
- Stock has been in a clear uptrend on the weekly chart for 8 months
- Currently pulled back to a strong support level that has held three times previously
- RSI has cooled from 72 to 48 — no longer overbought
- A bullish hammer candlestick formed at the support level in the last session
- Volume on the pullback is low — suggesting sellers are not aggressive
Technical conclusion: The stock is at a high-probability entry zone. The pullback to support with decreasing volume and a bullish reversal candle suggests a potential bounce from here.
Combined Sharelesh Decision: Fundamental analysis identified a strong company worth owning. Technical analysis identified the right moment to enter — at support, after a healthy pullback, with bullish signals. Together, both analyses produce a high-confidence decision that neither could produce alone.
This is the complete picture. This is what Sharelesh teaches.