Why Knowing 50 Patterns Makes You a Worse Trader
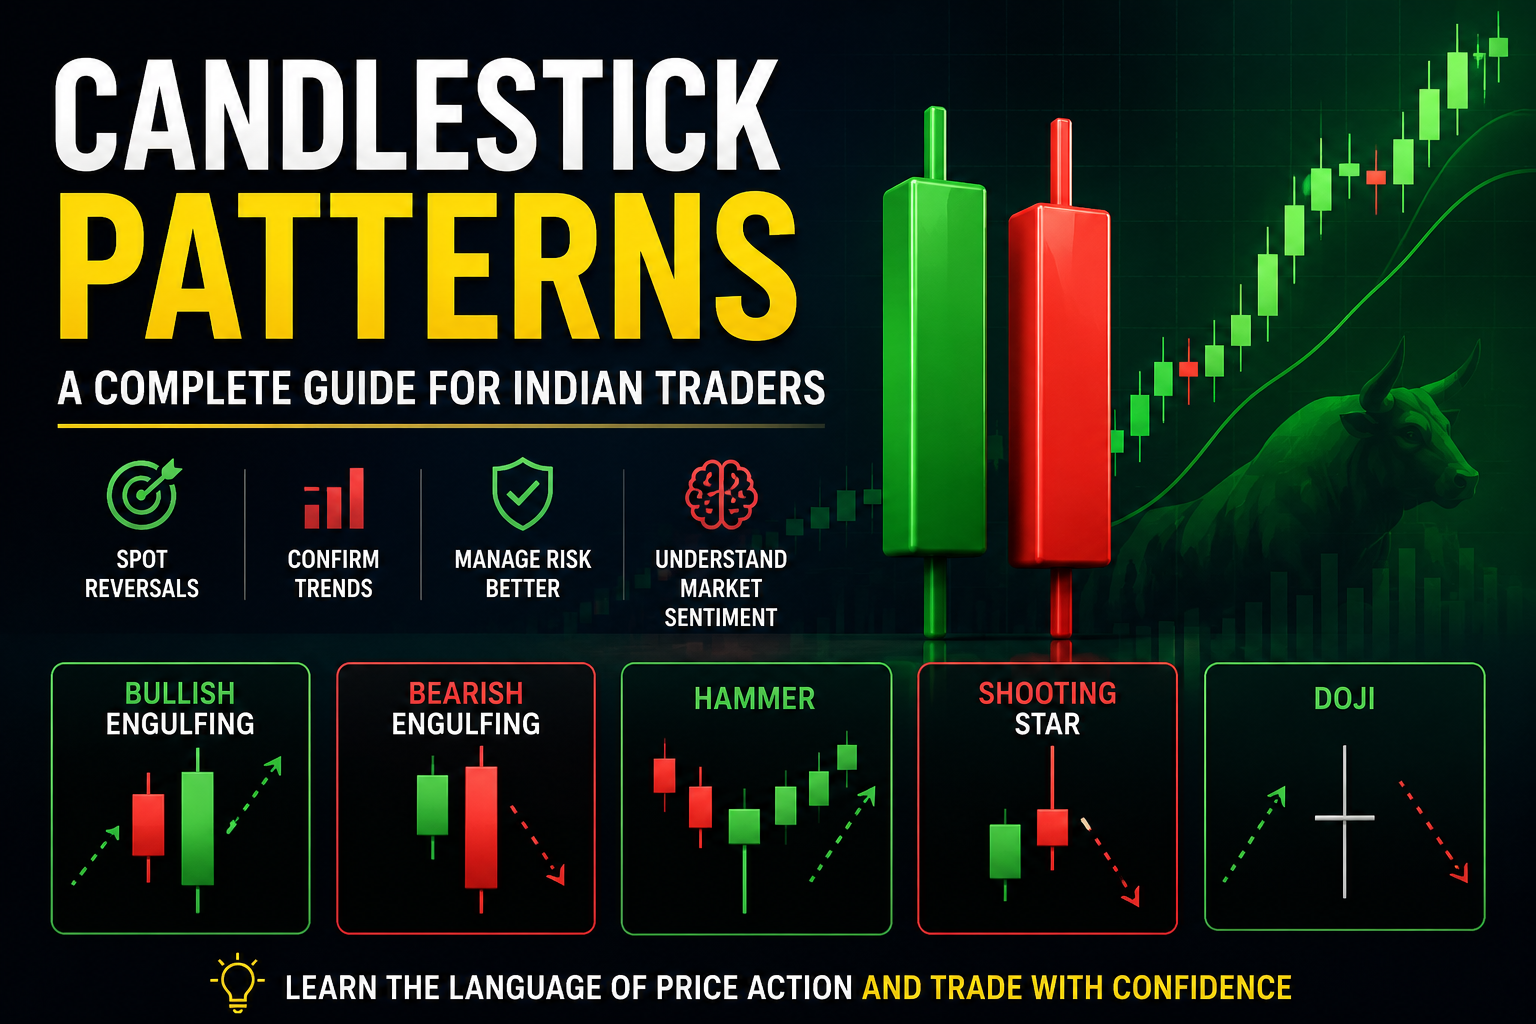
Search “candlestick patterns” on Google right now. Within seconds you will find guides listing 35 patterns, 45 patterns, even 100+ patterns – all promising that learning more patterns will make you a better trader.
It will not. In fact, it will make you worse.
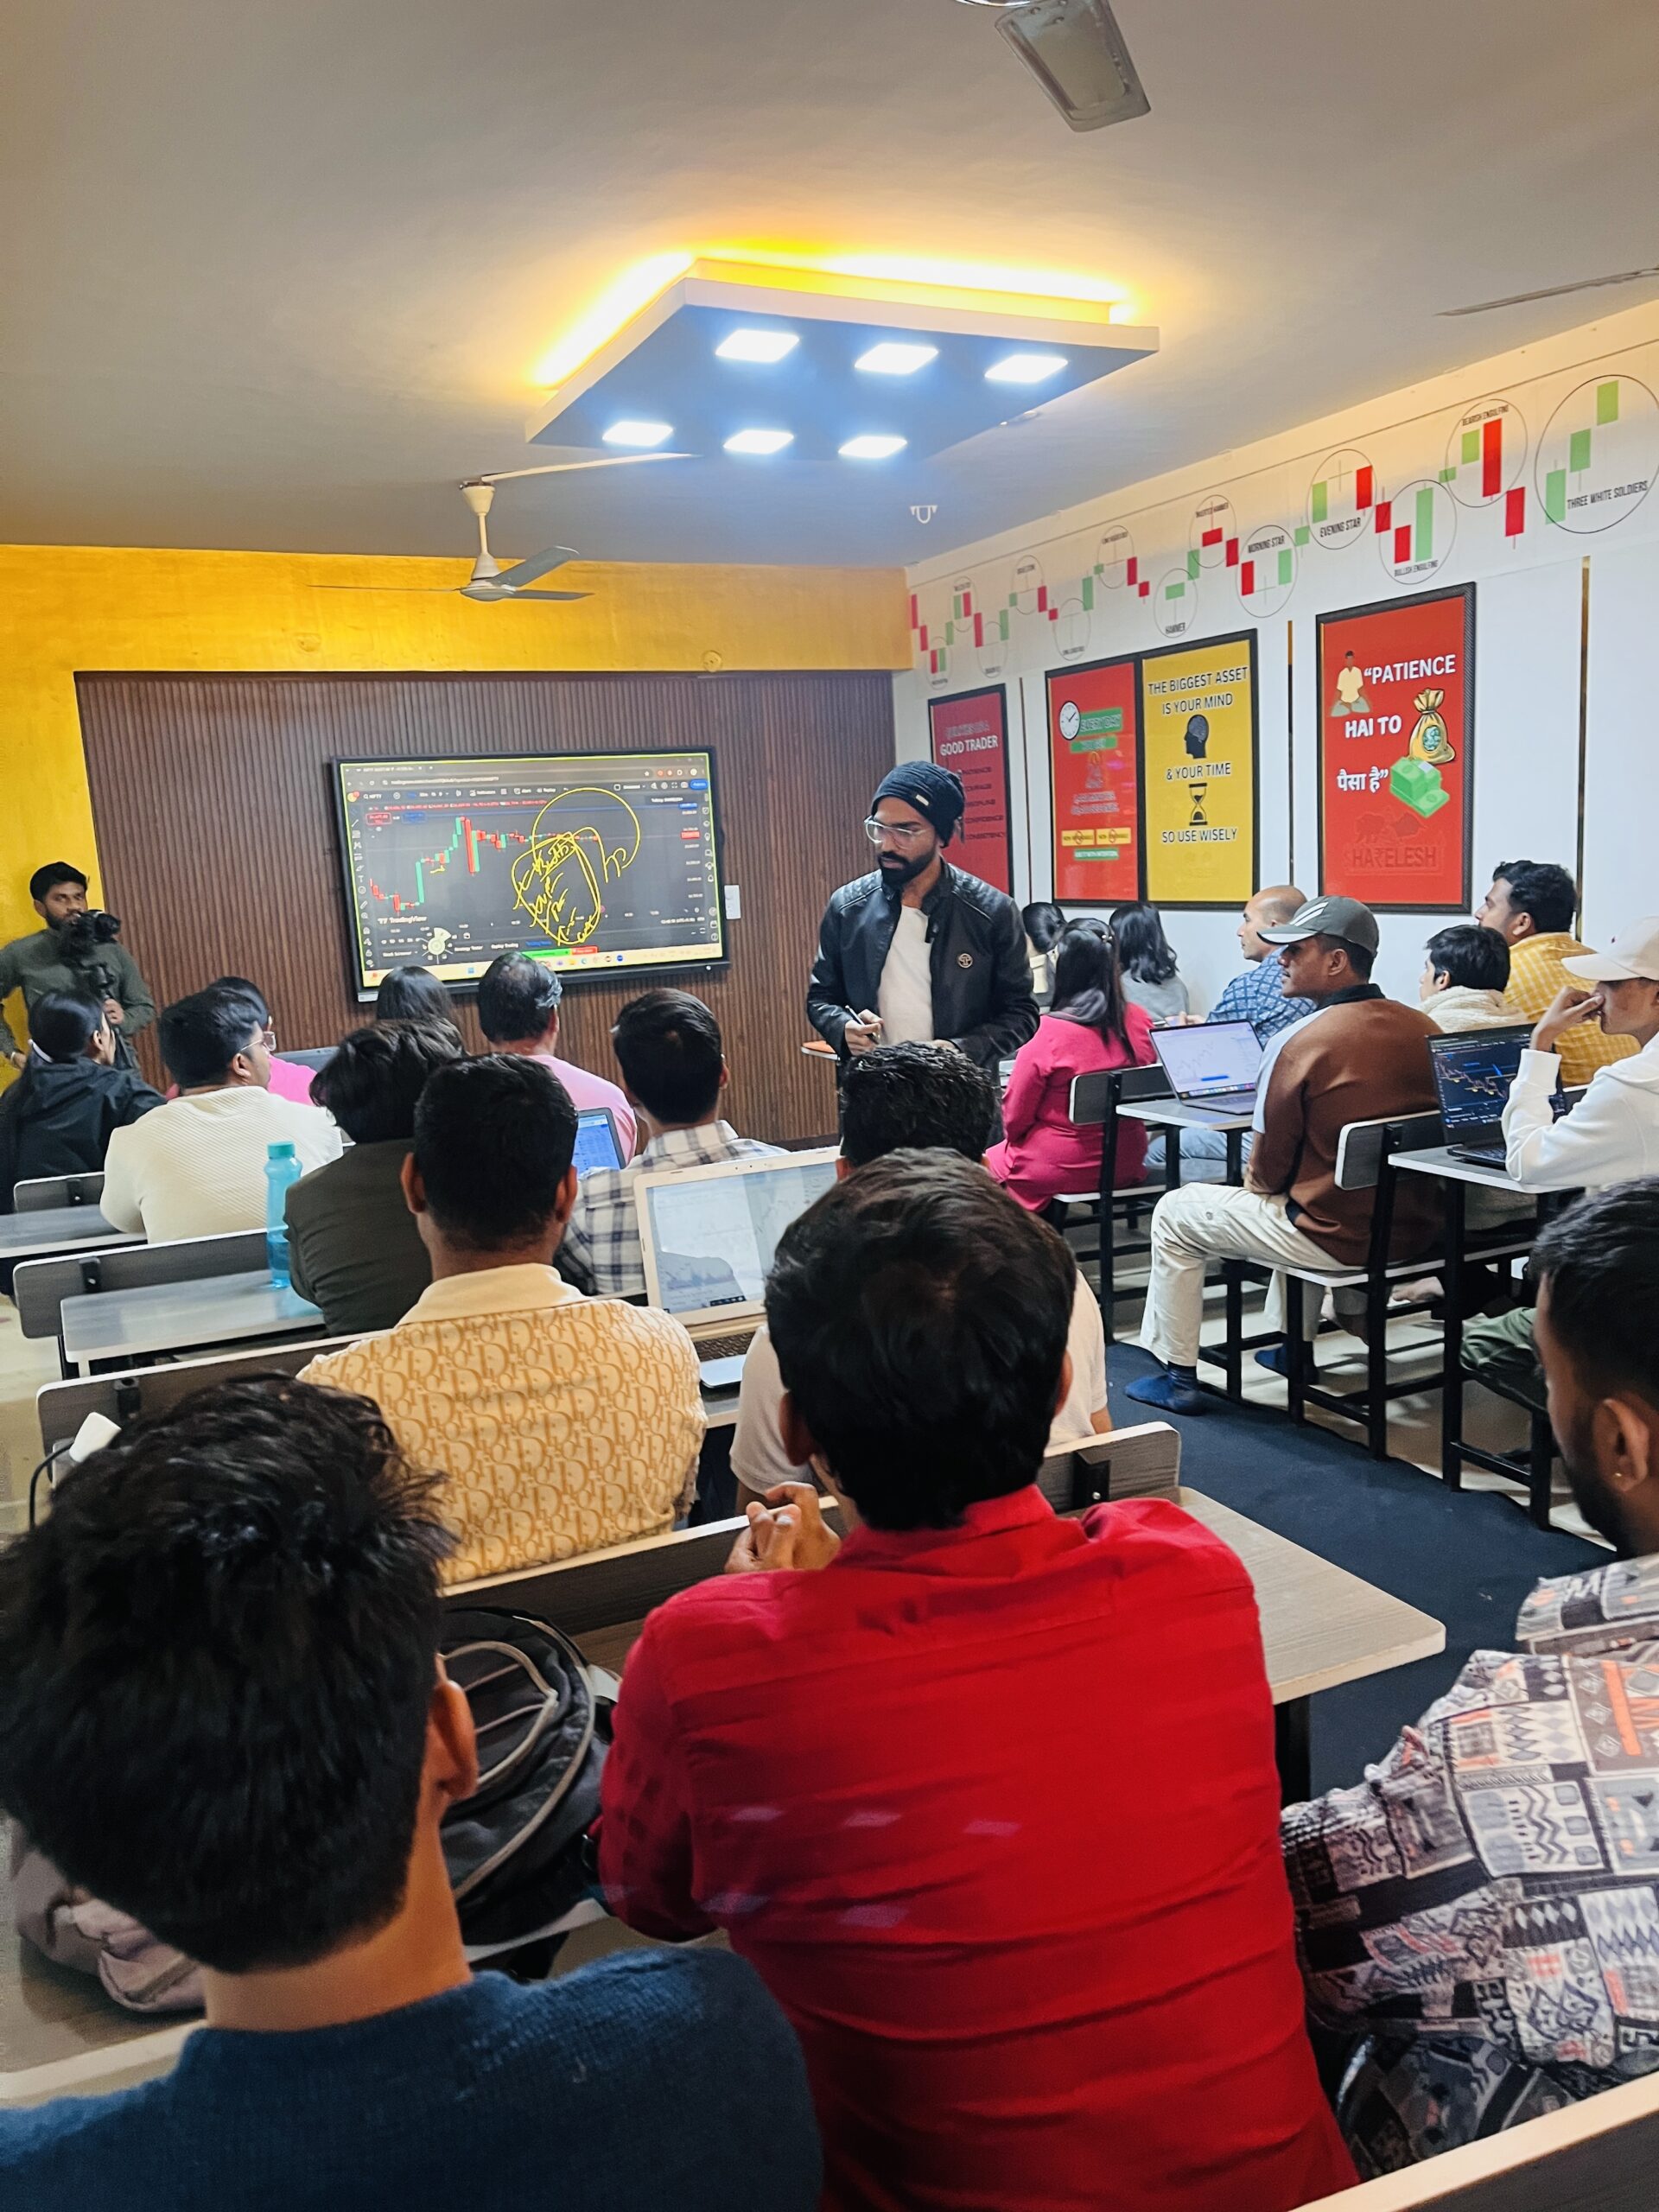
At Sharelesh, every week students arrive who have memorised dozens of candlestick patterns. They can name a Rickshaw Man. They recognise a Three Inside Up. They have a notebook full of pattern diagrams copied from YouTube videos. And they are consistently losing money in the market.
When we sit with them and open a live chart, the problem becomes immediately clear. They can name patterns in theory but they cannot spot them on a real chart in real time. They cannot tell whether a pattern they see is valid or invalid. They have no system for deciding entry, stop loss, or target when a pattern appears. And they trade every pattern they see without checking any conditions first.
This is the pattern overwhelm trap. And it is where most Indian traders are stuck right now.
At Sharelesh, after 17+ years of teaching candlestick analysis to thousands of students, we arrived at a completely different approach – one that produces consistently better results than memorising every pattern ever documented.
We teach 9 specific candlestick patterns. Each with its own validation conditions. Each with a proprietary formula for entry, target, and stop loss. Nothing more. Nothing less.
One of our students came to Sharelesh having already studied more than 30 candlestick patterns independently. He could describe every pattern accurately. Yet he was losing money on almost every trade. After joining Sharelesh and rebuilding his approach around our 9-pattern system with proper conditions and the Sharelesh entry formula – he had his first consistently profitable month within weeks. Not because he learned more patterns. Because he finally learned how to use fewer patterns correctly.
How to Read a Candlestick - The Four Numbers Every Candle Shows
Before understanding any candlestick pattern, you must first understand what a single candlestick actually tells you. Every candle on a chart whether on a 1 minute timeframe or a weekly timeframe contains exactly four pieces of information.
Open – The price at which trading began for that time period.
High – The highest price reached during that time period.
Low – The lowest price reached during that time period.
Close – The price at which trading ended for that time period.
These four numbers open, high, low, close are represented visually by the candle’s body and wicks. Together, they tell you everything that happened between buyers and sellers during that specific period of time.
WHAT IS CANDLESTICK ???
A candlestick is a visual representation of price movement that shows the open, high, low, and closing prices of a security during a specific time period.

Body and Wick Explained - The Story of Buyers and Sellers in Every Candle
Every candlestick tells a story. Not a random story – a very specific story about the battle between buyers and sellers during that time period. Learning to read this story is what separates traders who use candlesticks as a real tool from those who simply memorise names.
The Body – The rectangular portion of the candle between the open and close prices. A large body means one side dominated completely either buyers pushed price strongly upward or sellers pushed it strongly downward. A small body means neither side dominated, the battle was roughly equal and the session ended close to where it started.
The Upper Wick (Shadow) – The thin line above the body, extending to the session’s High. The upper wick tells you how high buyers pushed price during the session and how much of that gain sellers managed to reclaim before the close. A long upper wick means buyers tried hard but sellers pushed price back down significantly before the session ended. Seller strength is shown by upper wick length.
The Lower Wick (Shadow) – The thin line below the body, extending to the session’s Low. The lower wick tells you how far sellers pushed price down and how much buyers recovered before the close. A long lower wick means sellers tried hard but buyers pushed price back up significantly. Buyer strength is shown by lower wick length.
At Sharelesh, we teach students to read every candle as a story before they look at patterns. Ask yourself — who was in control? Who pushed hardest? Who recovered? What does this candle tell me about the balance of power between buyers and sellers right now?
This story-reading skill applied consistently is what makes the Sharelesh 9-pattern system work. Because when you understand the story behind each pattern, you do not need to memorise its appearance. You understand why it means what it means.
The Sharelesh Framework — Master 9 Not 50
Here is the most important truth about candlestick trading that no YouTube video or generic blog will tell you:
The market does not reward you for knowing the most patterns. It rewards you for executing the right patterns correctly.
At Sharelesh, we arrived at our 9-pattern system through 17+ years of live market teaching, student result tracking, and honest evaluation of which patterns consistently produce reliable signals on Indian charts — specifically on Nifty, Bank Nifty, and NSE-listed stocks.
The result is a curriculum built around these 9 specific patterns:
| Pattern | Signal Type |
|---|---|
|
Tweezer Top |
Bearish Reversal
|
|
Tweezer Bottom |
Bullish Reversal |
|
Perfect Tweezer Top |
Strong Bearish Reversal |
|
Perfect Tweezer Bottom |
Strong Bullish Reversal
|
|
Dragonfly Doji |
Bullish Reversal Signal |
|
Long Legged Doji |
Indecision / Reversal Warning |
|
Long Headed Doji |
Bearish Reversal Signal
|
|
Gravestone Doji |
Strong Bearish Reversal
|
|
Hammer |
Bullish Reversal |
Why These 9 Candlestick Patterns Matter Most
These patterns appear regularly on Indian index and stock charts. They are visually distinct enough to identify reliably in real time. And most importantly when combined with the Sharelesh validation conditions and entry formula. they produce high-probability, clearly defined trading setups.
But here is the critical difference between the Sharelesh approach and every generic candlestick guide you have read before:
At Sharelesh, every one of these 9 patterns has its own specific conditions that must be checked before the pattern is considered valid. A pattern that appears on the chart but does not meet its conditions is not a signal, it is noise.
This condition-checking system is what separates a Sharelesh-trained trader from a trader who simply memorises pattern shapes. And combined with the Sharelesh proprietary formula for calculating entry, stop loss, and target — it creates a complete, systematic approach to candlestick trading that removes guesswork entirely.
The full conditions and formula are taught exclusively inside the Sharelesh trading course because without proper live market context and guided practice, written conditions alone are insufficient. But understanding why conditions matter is the first step toward using any pattern correctly.
Tier 1 : Single Candle Patterns - The Foundation of Everything
Single candle patterns are the most important patterns to master first — because they appear most frequently and because understanding them deeply gives you the foundation to recognise two and three-candle formations accurately.
The Hammer — Bullish Reversal
What it looks like: A candle with a very small body at the top of its range, a long lower wick (at least twice the length of the body), and little to no upper wick.
The story it tells: Sellers pushed price significantly lower during the session — creating the long lower wick. But buyers stepped in aggressively and pushed price all the way back up to near the opening level before the session closed. The small body at the top shows buyers won the battle. The long lower wick shows how hard sellers tried — and failed.
What it signals: When a Hammer appears after a downtrend, at a significant support level, it signals that selling pressure is exhausting and buyers are beginning to take control. It is one of the most reliable bullish reversal signals on Indian charts.
The Sharelesh condition check: A Hammer that appears in the middle of a chart with no clear context is not a valid signal. At Sharelesh, every Hammer must pass its specific validation conditions before it qualifies as a tradeable setup. The conditions ensure the pattern has the context, the location, and the confirmation necessary to act on it. These conditions are taught exclusively in the Sharelesh curriculum.
The Dragonfly Doji — Bullish Reversal Signal
What it looks like: A candle where the open, high, and close are all at or very near the same price level — creating virtually no body — with a very long lower wick extending significantly below.
The story it tells: The session opened, sellers pushed price dramatically lower, and then buyers recovered the entire move — bringing price all the way back to the opening level before the close. The complete recovery by buyers — from a large sell-off — is a powerful statement of buyer strength.
What it signals: The Dragonfly Doji at a support level signals strong potential bullish reversal. The longer the lower wick, the more dramatic the buyer recovery — and the stronger the signal.
The Gravestone Doji — Strong Bearish Reversal
What it looks like: The mirror image of the Dragonfly Doji. Open, low, and close are all at or very near the same level, with a very long upper wick extending significantly above.
The story it tells: Buyers pushed price dramatically higher during the session — and then sellers completely overwhelmed them, pushing price all the way back to the opening level before the close. Complete seller domination after a strong buyer attempt.
What it signals: At a resistance level after an uptrend, the Gravestone Doji is one of the most powerful bearish reversal signals. The longer the upper wick, the more decisive the seller victory — and the stronger the bearish signal.
The Long Legged Doji — Indecision and Reversal Warning
What it looks like: Open and close at approximately the same level, with long wicks extending both above and below — creating a cross or plus-sign shape.
The story it tells: Both buyers and sellers fought aggressively during the session — pushing price significantly in both directions. But neither side won decisively. The session ended almost exactly where it started. Complete indecision.
What it signals: The Long Legged Doji signals that the existing trend is losing conviction. Neither buyers nor sellers can maintain control. When this appears after a prolonged trend, it warns that a reversal or significant consolidation may be approaching.
The Long Headed Doji — Bearish Reversal Signal
What it looks like: Similar to the Long Legged Doji but with a notably longer upper wick than lower wick — showing buyers attempted a strong move upward but were significantly beaten back by sellers.
The story it tells: Buyers made a strong attempt to push price higher but sellers defeated them convincingly — though not completely. The asymmetry between upper and lower wick tells you seller strength was greater than buyer strength during the session.
What it signals: At resistance levels, the Long Headed Doji signals that buying momentum is weakening and seller pressure is intensifying — a warning of potential bearish reversal.
Tier 2 : Two Candle Patterns - Confirmation Through Action
Two-candle patterns require two consecutive sessions to form. The first candle sets the context. The second candle confirms the directional shift.
Tweezer Top — Bearish Reversal
What it looks like: Two consecutive candles with approximately equal highs — forming a visual “tweezer” shape at the top of an uptrend. The first candle is typically bullish. The second reaches the same high but fails to exceed it — and closes lower.
The story it tells: In the first session, buyers pushed price to a new high. In the second session, buyers tried to push even higher — reached the exact same level — but could not break through. Sellers defended that level twice. The double rejection at the same high is a powerful signal that sellers are firmly in control at that price.
What it signals: At resistance levels after an uptrend, the Tweezer Top is a strong bearish reversal signal. The market has tested a high twice and failed — suggesting the upward momentum is exhausting.
Perfect Tweezer Top — Strong Bearish Reversal
What it looks like: Similar to the Tweezer Top but with specific additional conditions that make the pattern even more valid and powerful. The Perfect Tweezer Top meets all the standard Tweezer Top requirements plus the Sharelesh-specific validation conditions that confirm this is a high-probability bearish setup.
What it signals: The Perfect Tweezer Top is the stronger, more reliable version of the standard Tweezer Top. When a Tweezer Top meets all the Sharelesh validation conditions — it becomes a Perfect Tweezer Top, and the probability of a successful bearish trade increases significantly.
At Sharelesh, the exact conditions that distinguish a Perfect Tweezer Top from a standard one are part of our proprietary curriculum. This distinction — between a basic pattern and a validated, high-probability version of that pattern — is what makes the Sharelesh 9-pattern system different from every generic candlestick guide online.
Tweezer Bottom — Bullish Reversal
What it looks like: The mirror image of the Tweezer Top. Two consecutive candles with approximately equal lows at the bottom of a downtrend. Sellers pushed to a new low, then tried again in the next session — but buyers defended that level both times.
The story it tells: Buyers defended the same low price twice. The double rejection of selling pressure at the same level signals that buyers are firmly established at that support and the downward momentum is exhausting.
What it signals: At support levels after a downtrend, the Tweezer Bottom is a strong bullish reversal signal.
Perfect Tweezer Bottom — Strong Bullish Reversal
What it looks like: The Tweezer Bottom that meets all the Sharelesh-specific validation conditions — making it the highest-probability version of the bullish tweezer pattern.
What it signals: When a Tweezer Bottom meets every Sharelesh validation condition, it becomes a Perfect Tweezer Bottom — the most reliable bullish reversal signal in the Sharelesh curriculum. The full conditions are taught exclusively inside the Sharelesh trading course.
“Curious to see how the Sharelesh 9-pattern system actually works on a live chart — with real conditions and the entry formula in action?”
Join our free demo class and watch us apply the complete system on Nifty and Bank Nifty in real time. See the difference yourself before you decide anything.
The Golden Rules - Volume, Context and Confirmation
At Sharelesh, we teach three golden rules that apply to every candlestick pattern without exception. Without these three rules, even the most visually perfect pattern has a win rate below 50%.
Golden Rule 1 : Volume Confirmation is Non-Negotiable
A candlestick pattern without volume confirmation is an unverified signal. Volume tells you whether the market’s big players institutions, FIIs, domestic funds are behind the move or not.
A Hammer on high volume means significant buyers stepped in at that support level institutional participation confirms the signal. A Hammer on low volume means only retail traders are involved the signal is weak and unreliable.
At Sharelesh, we teach students to check volume before acting on any pattern. If volume does not confirm the pattern — either skip the trade entirely or reduce position size significantly. This single rule eliminates a large portion of losing trades that other candlestick approaches would have taken.
Golden Rule 2 : Location Matters as Much as the Pattern
A pattern at the wrong location on the chart is not a signal it is noise. A Hammer in the middle of a trend with no support level nearby is not a valid trade. A Gravestone Doji at a clear resistance level after a prolonged uptrend is a very high-probability signal.
The location rules at Sharelesh are simple: bullish reversal patterns are only valid at significant support levels. Bearish reversal patterns are only valid at significant resistance levels. A pattern that appears in random price space away from key levels — is ignored entirely.
Golden Rule 3 : One Perfect Trade Beats Ten Random Ones
This is perhaps the most important mindset shift Sharelesh teaches about candlestick trading.
Most traders see a pattern and immediately take the trade without checking conditions, without confirming volume, without verifying location. They take ten trades a day based on patterns and wonder why they are not profitable.
At Sharelesh, we teach the opposite approach. Wait for a pattern that meets all its validation conditions. Wait for volume confirmation. Wait for the right location. When all three align that is your trade. One such trade per day, executed with proper entry formula, stop loss, and target is more profitable than ten randomly taken pattern trades.
Quality beats quantity. Always.
When to Trade a Pattern and When to Wait : The Art of Pattern Validation
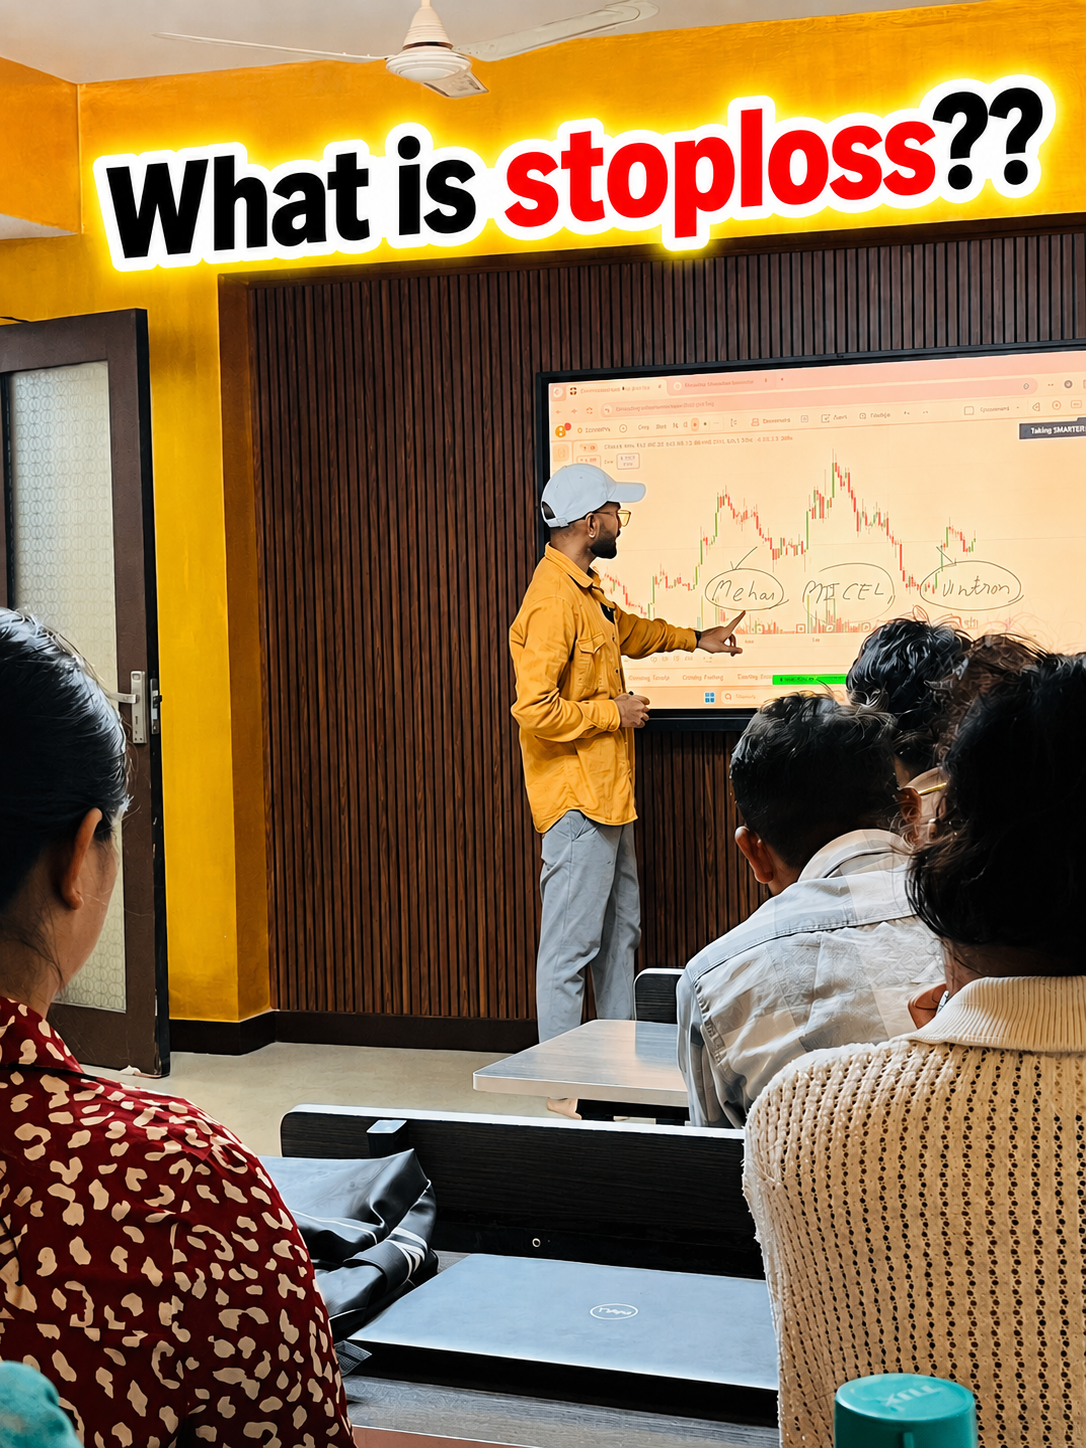
Every Sharelesh student learns this truth early: candlestick patterns are probability tools, not certainty tools. Even a perfect pattern with volume confirmation and ideal location will fail sometimes. This is normal. This is expected. And this is exactly why stop losses exist.
Patterns fail when:
- A larger trend overrides the reversal signal – a Hammer at support in a powerful downtrend may simply bounce briefly before continuing lower
- A major news event creates a gap that invalidates the technical setup earnings, regulatory changes, or global macro events can overwhelm any pattern
- The support or resistance level itself breaks when a level you expected to hold gives way, the pattern signal is invalidated
Understanding that patterns fail is not discouraging, it is liberating. Because once you accept that losses are part of the process, you stop removing stop losses and start managing risk correctly. The traders who understand pattern failure are the ones who survive long enough to profit from pattern success.
At Sharelesh, we teach students to measure their pattern performance over 50–100 trades – not 5.
“This is exactly what our free demo class covers — not just which patterns to trade, but when NOT to trade them, how to validate every setup, and how the Sharelesh formula removes the guesswork from every entry.
[Join Free Demo – See the Complete Validation System Live]“